
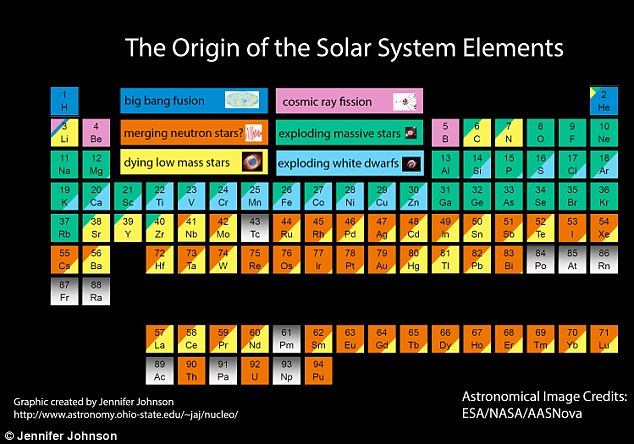
 The Periodic Table of Elements showing the origin(s) of each element, note that nearly all are made within stars. The Periodic Table of Elements showing the origin(s) of each element, note that nearly all are made within stars.
Element Abundances in the Solar Neighborhood
The only elements that were formed during the Big Bang were hydrogen and helium. As the universe slowly expanded and cooled, gas started to collect into massive balls (hundreds of times the mass of our Sun) which eventually formed the first stars. Within these stars, where temperatures and pressures are extremely high, the hydrogen and helium atoms would collide with each other and stick, forming new elements such as carbon and oxygen. The first stars lived short lives and when they died, their explosion sent their material -- including the newly-created elements -- all over the universe. However, like the universe itself, the stellar explosions were uneven, meaning they sent different kinds and amounts of elements to different regions of the universe. Eventually, these new elements would be swept up in another huge ball of gas and form a star. Instead of being composed of only hydrogen and helium, this star also had carbon and oxygen, which were the seeds for creating larger elements such as silicon, titanium, and iron. As this cycle continued, the rest of the Periodic Table was produced as a direct result of fusion within stellar interiors and explosions (or supernovae): Because the (nucleosynethetic) origin of every element varies, and because every region of the universe -- even the galaxy -- is affected by different phenomena, studying the elements within stars allows us to understand a variety of astrophysical phenomena. For example, when should a supernova have exploded near(ish) the Solar System such that we have the right elements to make the Earth habitable? What kinds of elements must be present in a planetary system such that they can be habitable (from our perspective)? Since stars and planets are formed out of the same "gas birth cloud," does a planet "steal" elements from its parent star or does the star need to have enough of particular elements so that a planet can be formed? What is the elemental interaction between stars and planets? What about binary systems, where two stars were born at the same time and now orbit each other, can they tell us how the birth cloud was split between two bodies? Is our Sun "normal" or different compared to stars of similar size and temperature? What is "abnormal"? What additional physics affect the element abundances -- for example, stars that rotate very quickly? Stars are the building blocks of the universe, they make-up both galaxies and planetary systems, therefore they can shed a lot light onto a wide variety of sub-fields within astronomy. My job is to try to understand these interactions a little better. Discrepancies in Stellar Abundance Techniques
Through my work, I analyzed elements abundances that were measured within the same star but by different groups using a variety of telescopes over the last ~25yrs. Below is an example of how these determinations graphically compare, with respective error bars (Hinkel et al. 2014). The stars and elements were chosen to be representative, simply because they were commonly measured. The obvious discrepancy between not only the five elements (Na, Si, O, ScII, and Al) but for iron as well is cause for serious concern; namely, abundance measurements by different groups do not produce the same result. As part of Arizona State University's Stellar Stoichiometry: Workshop Without Walls, I have been working with a team of international collaborators to analyze the same stellar spectra using a different techniques. The goal is to better understand how the methods, stellar parameters, and line lists affect the resulting abundance measurements, so that results will be more comparable. 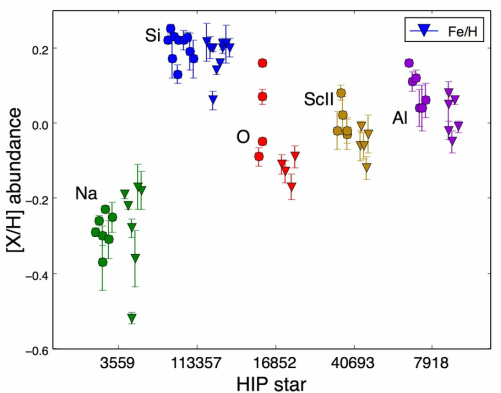
Data from the Hypatia Catalog showing the dispersion in abundance measurements for the same element (Na = green, Si = blue, etc.) in the same star (x-axis) by different literature sources (circles). The corresponding [Fe/H] measurements for each of the literature sources are shown as triangles. Individual error bars published by each group are shown -- note that in many cases they do not overlap, indicating there is a lack of consensus between abundance measurement techniques.
Observing Exoplanets
As part of my work with Stephen Kane, I am a member of the Transit Ephemeris Refinement & Monitoring Survey (TERMS) team. TERMS is able to analyze planetary systems with bright stars through the use of new RV and photometric measurements, which greatly improve the planetary orbit uncertainties and the fundamental properties of the host star. With this precision, we are able to significantly confirm or exclude planetary transit. In addition to TERMS, Stephen and I (along with a number of collaborators) have written a number of papers exploring habitable zones of circumbinary planetary systems, the possibility of as-yet-undiscovered exomoons, and better characterizing compact exoplanetary systems. See the ADS button above for our abstracts and papers. |
| Natalie Hinkel | Research |
